Paul's Blog
"The future foretold, the past explained, the present...apologised for.”
|
Doctor Who. BBC TV (1979)
|
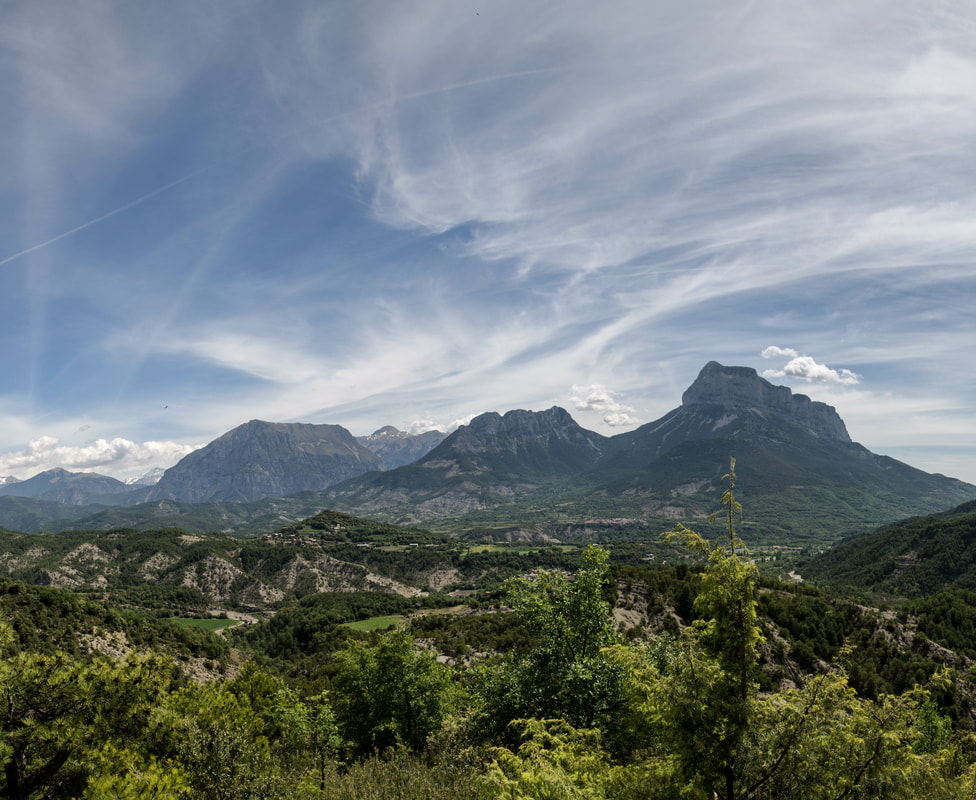 This blog is co-posted on the Knowing Earth website (www.knowing.earth) Paleogeographic maps come in a variety of forms. But it is as reconstructions of past landscapes that they are the most useful. Why? Because it is on these landscapes that the geological record is built. A particle sees topography, rivers, and oceans. It experiences rain and floods and the heat from the sun. It does not see mantle convection nor crustal hyper-extension nor differentiate between a compressional or extensional tectonic setting, at least not directly. How sediment is formed in the hinterland through weathering and erosion, transported and ultimately deposited is a function of what happens at the surface and therefore what that landscape is. A Google search for the term "paleogeography" reveals a wide range of maps and images. From simple black and white sketches showing past shorelines to maps of depositional systems or the distribution of tectonic plates, to full-color renditions of paleo-elevation and -bathymetry. Many, if not most, are informative, some are aesthetically quite beautiful. For most geologists, such maps need little introduction. They have a long history of usage in the literature, and today have become something approaching de rigueur for conference presentations and corporate montages. But paleogeography is more than just images in presentations. It is or can be, a powerful tool for managing, analyzing and visualizing geological information, for investigating the juxtaposition and interaction of Earth processes, as well as acting as the boundary conditions for more advanced Earth system modeling with which to better understand how our planet works. Over the next few months, I will present a series of blogs that will explore paleogeography. It will be a journey that will take us through the history of paleogeography, a look at how maps are generated, a guide to some of the pitfalls and caveats of mapping, a review of some of the mapping tools available, as well as examples of how paleogeographic maps have been used to solve real-world problems, especially in resource exploration where I have the most experience. It is a journey that I hope you enjoy and find useful. In this first blog, I want to set the scene by addressing two simple questions. What is paleogeography? And why should you care?  The Nature of the Problem: there is simply so much to take in. If we look at any landscape and the processes responsible for forming it and which are acting on it, such as in the central Pyrenees shown above, we are faced with something of a dilemma: There is simply so much to take in. For example, if we are teaching field geology in such an area do we focus on the structural evolution, or the stratigraphy, or the depositional systems or the climate, or vegetation or any one of the many components that together comprise the Geological record and the Earth system in this view? Or do we try and cover all the bases? Ideally, we want to try and cover everything. But we have limited time. We also do not want to overwhelm all concerned with diverse technical vocabulary and concepts. The risk of losing our audience. Consequently, we usually focus on a specific field of study. The same is true in exploration. Whether we are assisting management to make strategic decisions about where to explore or are a member of an asset team identifying and evaluating blocks and then prospects. We need to understand all the components of the Earth system if we are to make informed decisions. 30 years ago, companies would have had an army of in-house specialists on whom they could call for help to do this, and even more academic experts on retainers. But, those days have long since gone. Unfortunately, one thing that has not gone is the budget constraints of the commercial world. Exploration is, by its very nature, a net cost to an energy exploration business. So, in addition to the scientific challenges, in exploration, we are also faced with trying to extract the maximum value from limited budgets. So, what do we do? Finding solutions: Paleogeography as a key tool in the geologist’s toolbox We need a tool with which we can bring together (gather), manage, visualize and interrogate diverse geological information, information which is often sparse (especially in frontier exploration areas), sometimes questionable, and often equivocal. If we look to history for guidance, we find 19th-century geologists faced with the same problem. A growing volume of diverse geological information and how to deal with it. Over the preceding 100 years, scientists had tried to encapsulate the contemporary knowledge of the Earth system into a single book or series of books. Humboldt's Cosmos or Lyell's Principles are examples. But this had become next to impossible by the middle of the 19th century due to the sheer volume of information, resulting in an exacerbation of the scientific specialism that we have today. Humboldt’s opus itself was unfinished at his death and completed based on his notes. One solution to this problem was to use maps to distil visually this wealth of information. Ami Boué’s maps of the World, more commonly known through Alexander Keith Johnston's “Physical Atlas of Natural Phenomena” (Johnston, 1856) in the middle of the century., or Élisée Reclus’ excellent “The Earth” (Reclus, 1876) 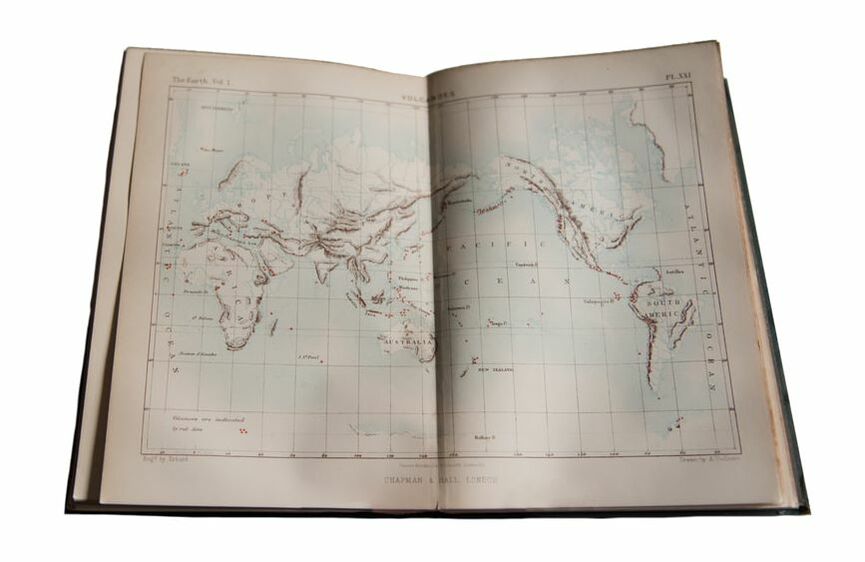 Reclus’s book on the Earth (Reclus, 1876) included maps showing the distribution of mountains and volcanoes. With the distribution of seismicity and you have all the information necessary for plate tectonics. With geology, the problem was exacerbated by the time dimension. This was not simply a matter of mapping the current physical state of the Earth and its processes but how this had evolved over time. The past geography of the Earth. This is Paleogeography. Paleogeography defined It is no coincidence that Thomas Sterry Hunt, the author attributed with first coining the term “paleogeography”, was also one of the first petroleum geologists, looking for ways to manage and analyze geological data for exploration. (We will revisit this in a later blog). Paleogeographic maps can summarise a wealth of geological information in a simple, visual way by distilling the record into representations of depositional environments and structures. This then allows additional information to be added and juxtapositions and relationships investigated. Such maps can also show lithological distribution and character, although strictly speaking facies maps are distinct from paleogeography’s in that they represent the product of processes, i.e. the rock record (as do GDEs for that matter), whilst a paleogeography represents the environment and landscape in which and on which those processes act and upon which the geological record is built. 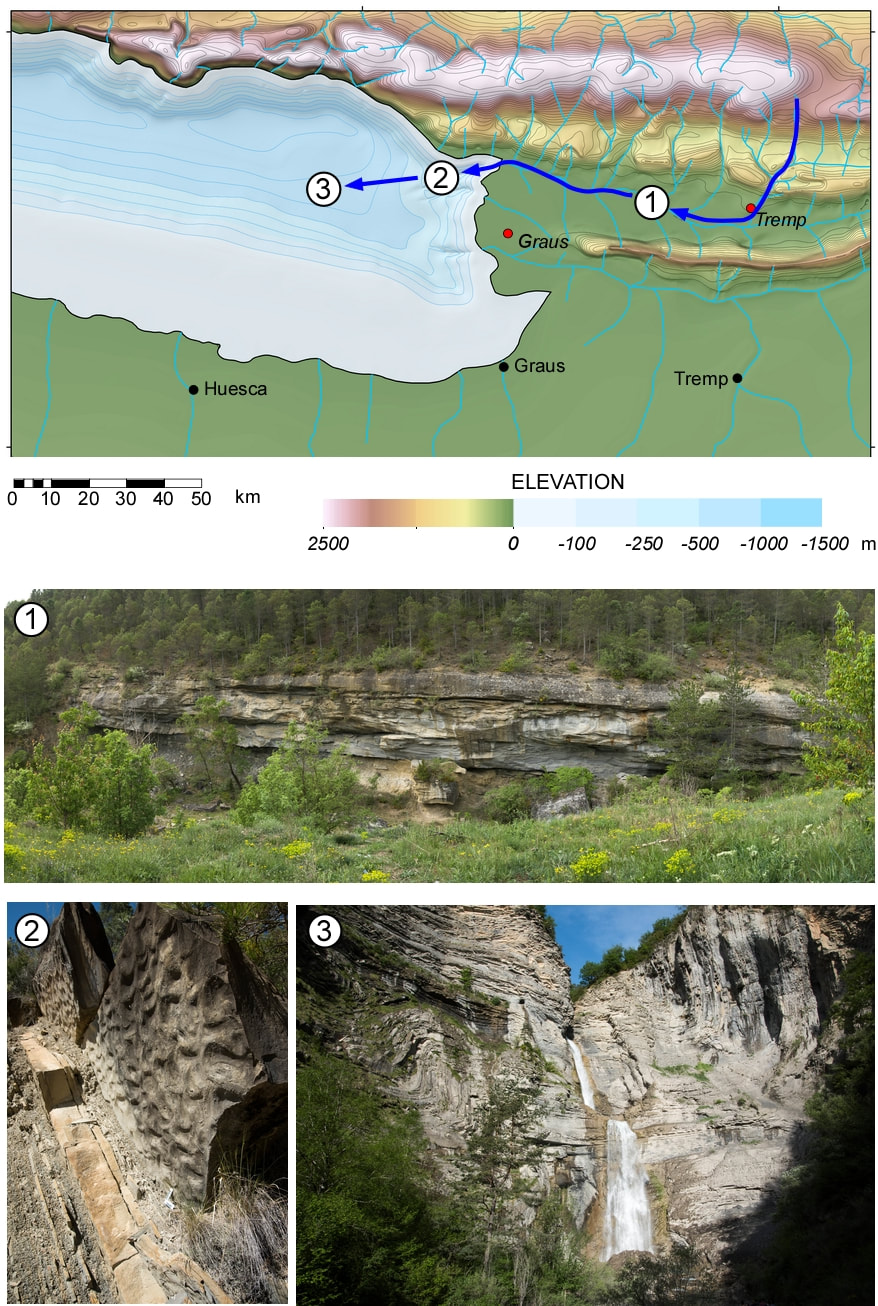 The late Ypresian paleogeography for the central Pyrenees showing one transport pathway that takes in the three outcrops shown. From Markwick (2019) In practice, this definition of paleogeography has become blurred. Facies maps, GDEs (Gross Depositional Environments), and plate reconstructions are all frequently referred to as “paleogeography”. The original definition of paleogeography proposed by Hunt was as a field within geology to describe the “geographical history” of the geological record, which to him included the depositional environments, such as deserts and seas (Hunt, 1873). This view of paleogeography as being the representation of the depositional environments that comprise a landscape is useful for two important reasons. First, because it allows us to distinguish between the landscape, the processes acting on the landscape, the processes that created the landscape, and the rock record that is the product of all of the above. This makes the Earth system more manageable. It also means that when building a map we can audit each step (something we will look at another time). But second, it allows us to deconstruct what the rock record directly responds to. What is important to consider. Where we need to focus our time (and monies). If we think of a sedimentary particle formed in the hinterland through weathering and erosion, transported and ultimately deposited, what does it really ‘see’ (i.e. respond to – at the risk of personifying clastic particles too much). A particle sees topography, rivers, and oceans. It experiences rain and floods and the heat from the sun. It does not see mantle convection nor crustal hyper-extension nor differentiate between a compressional or extensional tectonic setting, at least not directly. It responds to the contemporary landscape and the processes acting on it. 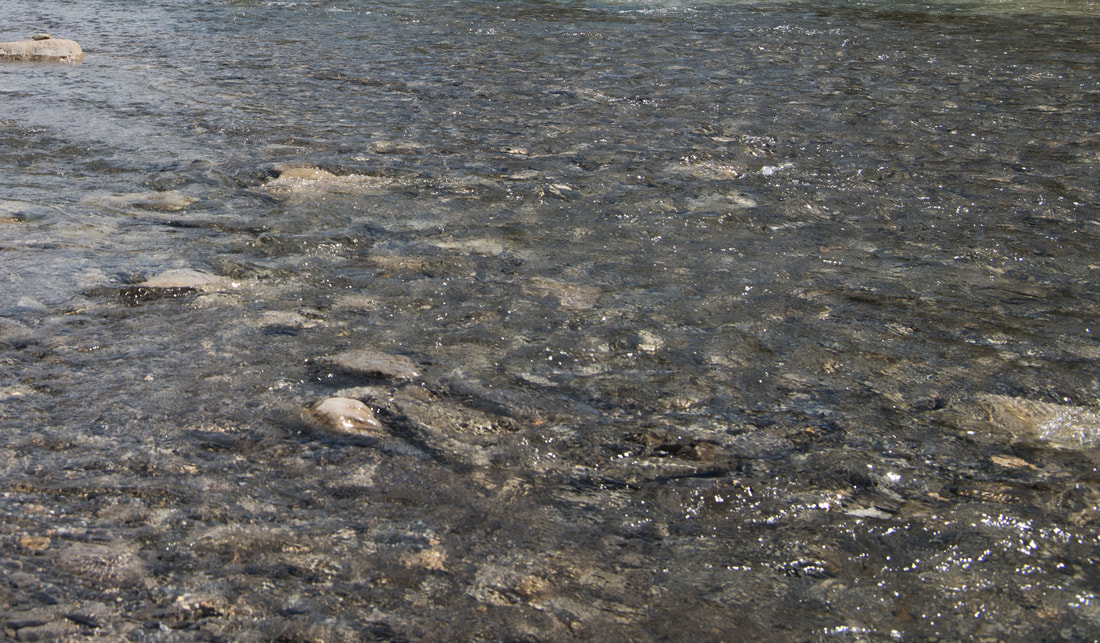 A particle eroded from the hinterland and transported to its depositional location responds on its journey to processes at the Earth surface Paleogeography defined: the problem of time We now need to add another component to our definition of what paleogeography is. And that is time. This is something that was identified by Charles Schuchert, a professor at Yale and colleague of Joseph Barrell, one of the founders of modern stratigraphy. 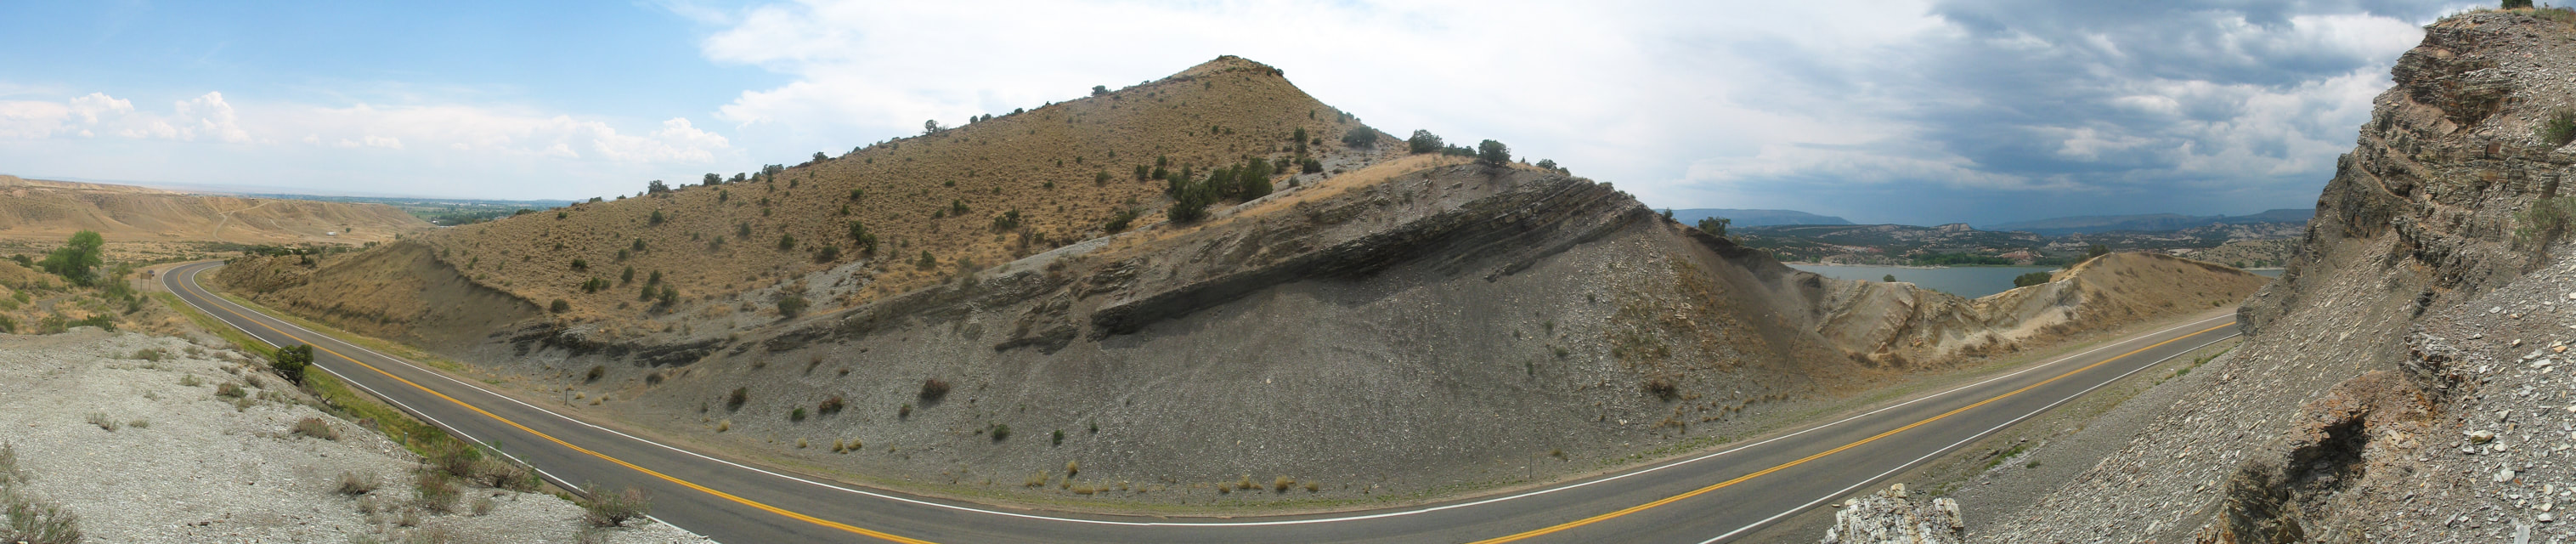 Cenomanian – Turonian section, Steinaker Reservoir. What would a Cretaceous paleogeography meaningfully represent? The transgressive shales or prograding sands or any range of other units through the Cretaceous The Earth is dynamic and landscapes and depositional environments and their products the rock record can change over relatively limited geographic distances and short temporal intervals. For Schuchert, a global Cretaceous map was meaningless, for the very simple reason of what exactly did it represent? A landscape at the beginning of the Cretaceous, the end, the maximum extent of marine conditions, or as more likely, a pastiche of lots of different parts of that Cretaceous record? Schuchert’s recommendation was to use the finest stratigraphic intervals possible, which for him were represented by stratigraphic formations. Kay went further to suggest that ideally paleogeography should represent a “moment in time”. Rather like looking at a satellite image. In this definition, paleogeography was a snapshot of the depositional environment and the landscapes at a specific moment. That makes perfect sense, but there is a problem. In the absence of a global correlation tool that can pick out a moment in time, this is next to impossible to achieve, especially over large distances. But it is an aspiration. It is also a reminder to ask of a map, what does it represent? Again, this is something we will return to in a later blog. In summary What is paleogeography? Paleogeography is the representation of the past surface of the Earth, at a ‘moment’ in time. Why is it important and why should you care? Because it allows us to bring together diverse information that will help us better understand the Earth system, whether we are teaching in Spain or faced with deciding on where to explore. Paleogeography gives us the spatial context for gathering, managing, visualizing and analyzing a wide array of geological information in a way that is easy to digest. At the end of the day, paleogeography is far more than just an image in a presentation. 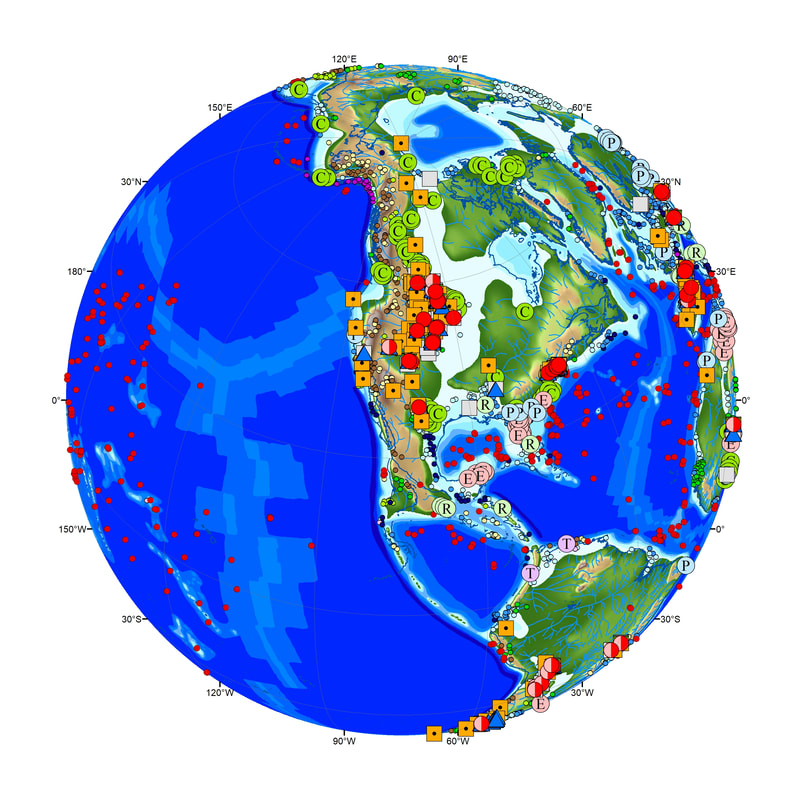 Maastrichtian paleogeography showing the distribution of DSDP and ODP sites (small red circles) and vertebrates (Markwick and Valdes, 2004; Markwick, 2007) This blog is one of a series based on a lecture course on paleogeography. Readers are also directed to a new paper on paleogeography published in the Geological Magazine: https://www.cambridge.org/core/journals/geological-magazine/article/palaeogeography-in-exploration/444CC2544340A699A01539A2D4C6E92A REFERENCES CITED Hunt, T. S., 1873, The paleogeography of the North-American continent: Journal of the American Geographical Society of New York, v. 4, p. 416-431. Johnston, A. K., 1856, The physical atlas of natural phenomena, London, William Blackwood & Sons, 137 p.: Markwick, P. J., 2007, The palaeogeographic and palaeoclimatic significance of climate proxies for data-model comparisons, in Williams, M., Haywood, A. M., Gregory, F. J., and Schmidt, D. N., eds., Deep-time perspectives on climate change: London, The Micropalaeontological Society & The Geological Society of London, p. 251-312. Markwick, P. J., 2019, Palaeogeography in exploration: Geological Magazine (London), v. 156, no. 2, p. 366-407. Markwick, P. J., and Valdes, P. J., 2004, Palaeo-digital elevation models for use as boundary conditions in coupled ocean-atmosphere GCM experiments: a Maastrichtian (late Cretaceous) example: Palaeogeography, Palaeoclimatology, Palaeoecology, v. 213, p. 37-63. Reclus, É., 1876, The Earth. A descriptive history of the phenomena of the life of the Globe, Leicester Square, London, Bickers and Son. A pdf version of this blog is available here PDF
0 Comments
 Paleogeographic maps are common throughout the Earth sciences. There seem to be few geological presentations today, in either Academia or Industry, that do not include at least one paleogeography, some of which have become aesthetically quite beautiful. But, despite this, the full power of paleogeography as a tool in geological problem solving remains underutilized. In many, if not most cases, maps are used simply as a backdrop image for locating data. That is a great shame. When Thomas Sterry Hunt first coined the phrase 'paleogeography' in 1873 (Hunt, 1873), it was not just as a 'pretty' picture for a presentation, but as a way to bring together diverse geological information to better understand the Earth system. Hunt was one of the first petroleum geologists, and by the time of his paper, he was faced with the problem of a rapidly expanding library of geological observations and ideas that needed to be managed. A situation that is all the more applicable today. Earlier geologists had used land-sea maps as one means of managing and visualizing this wealth of information. But, it was Hunt who applied these maps to exploration and who established the first systematic workflow for building paleogeography by stressing the importance of the underlying crustal architecture. This workflow was expanded and developed by Charles Schuchert in the early 20th century (Schuchert, 1910, 1928) and later by Fred Ziegler (Ziegler et al., 1985) and the Paleogeographic Atlas Project (the subjects of future blogs). Paleogeography has long been a passion with me ever since I was an intern at BP’s research center in Sunbury-on-Thames back in the mid-1980s. The first atlases of global plate reconstructions had been published 10 years before (Briden et al., 1974; Smith and Briden, 1977; Smith et al., 1973) and by the 1980s were becoming much more widely used. In Chicago, Fred Ziegler’s Paleogeographic Atlas Project was developing new methods for mapping and applying the results directly to exploration problems (Ziegler et al., 1985), including the use of paleogeography with paleoclimatology to retrodict (predict the past state) the distribution of source rocks. This had demonstrated to the oil and gas exploration industry that there might be a better and cheaper way to do preliminary basin screening. This is where I came into the story, working on paleogeographic maps, paleoclimatology, source rock databases, and retrodictions. It was a great time with so many new developments and ideas about the Earth. Many groups have developed paleogeographies over the years. Too many to mention in one blog or paper. One could mention the influential atlases of Peter Ziegler at Shell (Ziegler, 1982), the ground-breaking Russian atlases of Vinogradov (1968, 1969; 1967; 1968) and then Ronov (1989; 1984) and their teams in Moscow, the coastline maps of Smith et al., at Cambridge (and BP) (Smith and Briden, 1977; Smith et al., 1994); the maps of Dore in Statoil (Doré, 1989), and Dércourt in France (Dercourt et al., 1993), and more recently the excellent work by the University of Rennes research group of Francois Guillocheau (Chaboureau et al., 2013). Not forgetting, of course, the highly influential and widely used maps of Chris Scotese (Scotese, 2008; Scotese et al., 1979; Scotese and Golonka, 1992), who has perhaps done more than most geologists to promote plate reconstructions and paleogeography. It was on Chris’s maps that Ron Blakey from Arizona first generated his beautiful 'Photoshopped' maps which many of you have seen and probably used. But, for me, it was the developments by what I refer to as the 'Chicago School' that were the most influential, especially in the exploration Industry. It was at Chicago that Chris Scotese published his initial work as a post-doc of Fred's, where Dave Rowley and Ann Lottes published a series of papers on plate modeling, and where many of Fred’s students, including Mike Hulver (now at Saudi Aramco), myself (Markwick and Valdes, 2004) and others learned and developed our understanding of geology and paleogeography, as well as methodologies for data management, auditing, and visualization. The Paleogeographic Atlas Project is important to the story of paleogeography and its applications in two principal ways: 1. The reconstruction of paleolandscapes, not just depositional systems or facies. 2. Data management, data verification, and auditing and digital databasing, building on the ideas of earlier workers such as Schuchert (1910) and Kay (1945) Paleolandscapes are key because at the end of the day this is what the rock record sees. A particle weathered from the highlands in the hinterland of a basin, does not see mantle anomalies, or hyper-extended crust, at least not directly. It sees the vegetation, rivers, lakes, and sea. It sees the surface of the Earth, which is the landscape. Data management, because without an audit trail how do you know how good the maps are? This was and is critical for the exploration industry with their need to understand exploration risk, in order to make informed decisions. Decisions that have a financial cost. The Paleogeography Atlas Project was sponsored by the oil and gas industry and so these questions and drivers were foremost in Fred's mind. It was also this link with the Industry that stimulated the work of Judy Parrish in the early 1980s and her seminal publications on source rock retrodiction using early parametric paleoclimate models and paleogeography to reconstruct the location of ocean upwelling. These models were subsequently computerized by Scotese and Summerhayes (1986). Over the last 18 months, I have been revisiting this story. One result is this paper on “Paleogeography in Exploration” (Markwick, 2018). This is designed to provide an introduction to the history and methodologies of paleogeography, including the latest version of Hunt’s mapping workflow. Associated with this is a new mapping legend, which is available through the publication as supplemental data, as well as online as digital .style files for use with ESRIs ArcGIS. Three case studies are given which show how paleogeography can be applied at different scales to solve different exploration problems. There is much more to add to this story and more will follow. But, for now, my aim to get the next generation of geologists, and especially explorationists, thinking about how they can use paleogeography maps more effectively in their workflows. And also, I hope, to get them excited about reconstructing the Earth system, an excitement I first discovered back in BP in the mid-1980s. At the very least I hope that readers will see that paleogeography is so much more than just a flat image, beautiful that these may be. "Palaeogeography in Exploration" was published online in June 2018 in the Geological Magazine and will be published as part of the “Advances in Palaeogeography” volume in early 2019. https://doi.org/10.1017/S0016756818000468 I wish to thank the volume editor, Guido Meinhold, for all his hard work in putting together a very interesting collection of papers on this important topic and for his kind inclusion of my research. I am also indebted to the reviewers, especially Tony Doré, for their perseverance in reading the original draft, which as they described it, read “more like a book…” The final version greatly benefited from their suggested changes and their dedication to the review process. They will be relieved to hear that the final version is considerably shortened. A book will be out shortly. REFERENCES CITED Briden, J. C., Drewry, G. E., and Smith, A. G., 1974, Phanerozoic equal-area world maps: The Journal of Geology, v. 82, no. 5, p. 554-574. Chaboureau, A.-C., Guillocheau, F., Robin, C., Rohais, S., Moulin, M., and Aslanian, D., 2013, Palaeogeographic evolution of the central segment of the South Atlantic during Early Cretaceous times: palaeotopographic and geodynamic implications: Tectonophysics, v. 604, p. 191-223. Dercourt, J., Ricou, L. E., and Vrielynck, B., 1993, Atlas Tethys palaeoenvironmental maps: Paris, Gauthier-Villars / CCGM. Doré, A. G., 1989, Mesozoic paleogeography, seaways and connections between Europe and the Arctic Sea, 28th International Geological Congress: Washington, D.C., p. 408. Hunt, T. S., 1873, The paleogeography of the North-American continent: Journal of the American Geographical Society of New York, v. 4, p. 416-431. Kay, M., 1945, Paleogeographic and palinspastic maps: American Association of Petroleum Geologists Bulletin, v. 29, no. 4, p. 426-450. Markwick, P. J., 2018, Palaeogeography in exploration: Geological Magazine (London), p. 1-42. Markwick, P. J., and Valdes, P. J., 2004, Palaeo-digital elevation models for use as boundary conditions in coupled ocean-atmosphere GCM experiments: a Maastrichtian (late Cretaceous) example: Palaeogeography, Palaeoclimatology, Palaeoecology, v. 213, p. 37-63. Ronov, A. B., Khain, V. E., and Balukhovski, A., 1989, Atlas of lithological paleogeographic maps of the world: Mesozoic and Cenozoic of the continents, Leningrad, USSR Academy of Sciences, 79 p.: Ronov, A. B., Khain, V. E., and Seslavinski, A., 1984, Atlas of lithological paleogeographic maps of the world: Late Precambrian and Paleozoic of the continents, Leningrad, USSR Academy of Sciences, 70 p.: Schuchert, C., 1910, Paleogeography of North America Geological Society of America Bulletin, v. 20, p. 427-606. -, 1928, The making of paleogeographic maps: Leopoldina, v. 4, no. Amerikaband, p. 116-125. Scotese, C. R., 2008, Plate tectonic and paleogeographic mapping: state of the art: Search and Discovery, v. Article #40312. Scotese, C. R., Bambach, R. K., Barton, C., Van der Voo, R., and Ziegler, A. M., 1979, Paleozoic base maps: Journal of Geology, v. 87, p. 217-277. Scotese, C. R., and Golonka, J., 1992, PALEOMAP Paleogeographic Atlas: Department of Geology, University of Texas at Arlington. Scotese, C. R., and Summerhayes, C. P., 1986, Computer model of paleoclimate predicts coastal upwelling in the Mesozoic and Cainozoic: Geobyte, v. 1, p. 28-42. Smith, A. G., and Briden, J. C., 1977, Mesozoic and Cenozoic Paleocontinental Maps, London, Cambridge University Press, 63 p.: Smith, A. G., Briden, J. C., and Drewry, G. E., 1973, Phanerozoic world maps, in Hughes, N. F., ed., Organism and continents through time: a symposium, The Paleontological Association, p. 1-42. Smith, A. G., Smith, D. G., and Funnell, B. M., 1994, Atlas of Mesozoic and Cenozoic coastlines, Cambridge, Cambridge University Press, 54 p.: Vinogradov, A. P., 1968, Atlas of the lithological-paleogeographical maps of the USSR. Volume I. Pre-Cambrian, Cambrian, Ordovician and Silurian.: Moscow, Ministry of Geology in the USSR and Academy of Sciences of the USSR, p. 52. -, 1969, Atlas of the lithological-paleogeographical maps of the USSR. Volume II. Devonian, Carboniferous and Permian: Moscow, Ministry of Geology in the USSR and Academy of Sciences of the USSR, p. 65. Vinogradov, A. P., Grossheim, V. A., and Khain, V. E., 1967, Atlas of lithological-paleogeographical maps of the USSR. Volume IV. Paleogene, Neogene and Quaternary, Moscow, Ministry of Geology in the USSR and Academy of Sciences of the USSR, v. I, 100 p.: Vinogradov, A. P., Vereschchagin, V. N., and Ronov, A. B., 1968, Atlas of lithological-paleogeographical maps of the USSR. Volume III. Triassic, Jurassic and Cretaceous, Moscow, Ministry of Geology in the USSR and Academy of Sciences of the USSR, v. III, 110 p.: Ziegler, A. M., Rowley, D. B., Lottes, A. L., Sahagian, D. L., Hulver, M. L., and Gierlowski, T. C., 1985, Paleogeographic interpretation: with an example from the Mid-Cretaceous: Annual Review of Earth and Planetary Sciences, v. 13, p. 385-425. Ziegler, P. A., 1982, Geological atlas of western and central Europe, Elsevier, 130 p. A pdf version of this blog is available here PDF
|
AuthorPaul Markwick Archives
August 2020
Categories
All
|
 RSS Feed